
 English
 Español
 中文
中文 हिन्दी
 Français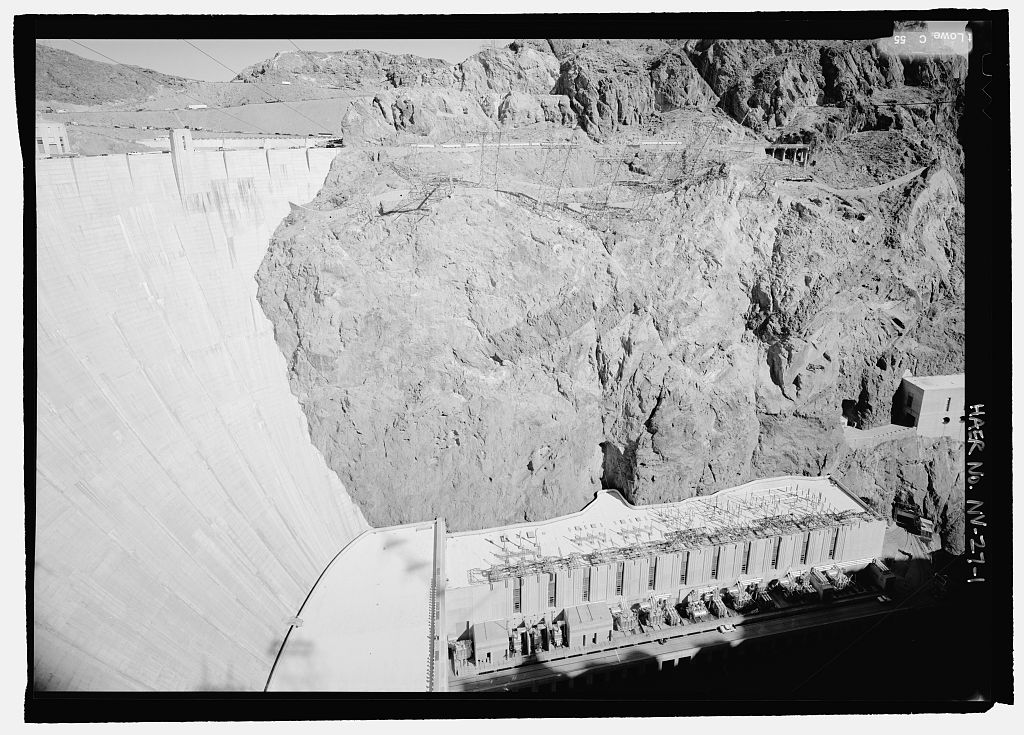
World Water Resources
Earth's freshwater: where it is, how it moves, and how humanity uses it.
Water covers roughly seventy-one percent of Earth's surface and is the single substance on which every ecosystem, economy, and civilization ultimately depends. Yet of the approximately 1.386 billion cubic kilometers of water estimated to exist on the planet, only about two and a half percent is freshwater, and the great majority of that freshwater is locked in glaciers, ice caps, and deep groundwater. The way this limited, unevenly distributed resource moves through the atmosphere, the oceans, the continents, and the biosphere shapes agriculture, public health, industry, geopolitics, and the prospects of the United Nations Sustainable Development Goals.
Overview
World water resources refer to the total quantity, distribution, quality, and flows of water available to sustain ecosystems and human societies on Earth. The physical system that circulates this water, known as the hydrological cycle, moves an estimated 500,000 cubic kilometers of water each year between the oceans, the atmosphere, and the land surface. Precipitation delivers approximately 119,000 cubic kilometers of this water onto continents, where it feeds rivers, lakes, wetlands, soils, and underground aquifers before eventually returning to the sea or evaporating back into the atmosphere. Human societies intercept a small fraction of this flow to grow food, supply cities, generate power, and sustain industry.
Although the global water budget has remained broadly stable on human time scales, water is extremely unevenly distributed in both space and time. A handful of large river basins, including the Amazon, the Congo, and the Ganges-Brahmaputra-Meghna, carry an outsized share of the world's river discharge, while arid regions such as the Sahara, the Arabian Peninsula, the Atacama, and the inland basins of Central Asia receive very little precipitation. Seasonal monsoons, snowmelt cycles, and multi-year drought and flood patterns add further variability that water managers must accommodate. Ancient fossil aquifers that recharge over thousands of years lie beneath regions where surface water is chronically scarce, and modern groundwater pumping is drawing many of them down faster than they can be replenished.
Competition for limited water creates challenges that are at once technical, economic, institutional, and political. Agriculture accounts for roughly seventy percent of global freshwater withdrawals, industry about nineteen percent, and municipal uses about eleven percent, according to the Food and Agriculture Organization of the United Nations. Nearly three hundred river basins cross international borders, requiring treaties and joint institutions to allocate flows and manage quality. The United Nations World Water Development Report, prepared by UNESCO's World Water Assessment Programme, publishes annual syntheses of this global picture, while the World Health Organization and UNICEF Joint Monitoring Programme measures progress toward universal access to safely managed drinking water, sanitation, and hygiene.
This article surveys the physical hydrology of the planet, the principal surface and groundwater resources, patterns of water use, the main categories of water infrastructure, water scarcity and stress, transboundary cooperation, and the international framework around Sustainable Development Goal 6. It is intended as an encyclopedic reference point, with links to more detailed topic pages on world rivers and lakes, world oceans and seas, and related environmental topics.

Key Facts
- Total water on Earth
- Approximately 1.386 billion cubic kilometers
- Share that is saline
- Approximately 97.5 percent (oceans and saline groundwater)
- Share that is freshwater
- Approximately 2.5 percent (about 35 million cubic kilometers)
- Freshwater in glaciers and ice
- Approximately 68.7 percent of all freshwater
- Freshwater as groundwater
- Approximately 30.1 percent of all freshwater
- Surface freshwater and other
- Approximately 0.3 percent in lakes, rivers, and wetlands; the remainder in soil moisture, the atmosphere, and biological tissue
- Largest freshwater lake by volume
- Lake Baikal in Siberia, holding roughly 23,000 cubic kilometers, about one fifth of the world's surface freshwater
- Global water withdrawals
- Approximately 4,000 cubic kilometers per year (FAO AQUASTAT)
- Withdrawal by sector
- Agriculture approximately 70 percent, industry approximately 19 percent, municipal approximately 11 percent (FAO)
- Transboundary river basins
- 286 international river basins covering about 46 percent of Earth's land surface
- People without safe drinking water
- Approximately 2.2 billion lack safely managed drinking water services (WHO/UNICEF Joint Monitoring Programme)
- People without safe sanitation
- Approximately 3.5 billion lack safely managed sanitation services (JMP)
- Ramsar wetland sites
- More than 2,500 designated Wetlands of International Importance covering over 2.5 million square kilometers
The Hydrological Cycle
The hydrological cycle, also called the water cycle, describes the continuous movement of water among the oceans, the atmosphere, the land, and living organisms. Energy from the Sun drives evaporation from the oceans, from inland water bodies, and from moist soil, while plants release water vapor through transpiration from their leaves. Together, these processes are often described as evapotranspiration, and they return an estimated 500,000 cubic kilometers of water to the atmosphere each year. Approximately 86 percent of global evaporation occurs from the oceans, which act as the main source for atmospheric moisture.
Once aloft, water vapor cools, condenses, and forms clouds, eventually falling as precipitation in the form of rain, snow, sleet, or hail. Global precipitation returns roughly the same total volume to the surface that evapotranspiration removes, but the geographic pattern differs sharply from the pattern of evaporation. Ocean areas receive approximately 78 percent of global precipitation, while continents receive the remaining 22 percent, amounting to some 119,000 cubic kilometers of freshwater falling on land each year. The excess of precipitation over evapotranspiration on land, about 47,000 cubic kilometers per year, constitutes the renewable freshwater supply that flows back to the oceans as rivers and as submarine groundwater discharge.
On the land surface, precipitation follows several pathways. Some water flows directly across the land as overland runoff into streams and rivers. Some infiltrates the soil, where it may be taken up by plant roots or percolate deeper into the subsurface to recharge groundwater. Snow and ice store water seasonally or over much longer periods in glaciers and ice sheets, releasing it gradually through melt. Residence times vary enormously across these compartments. Water molecules remain in the atmosphere for about nine days on average, in rivers for a few weeks, in lakes for years to decades, in shallow groundwater for decades to centuries, in deep aquifers for millennia, in the oceans for about 2,500 years, and in the great ice sheets for tens of thousands of years or more.
Natural climate variability, including the El Niño and La Niña phases of the El Niño-Southern Oscillation, shifts precipitation patterns from year to year and can produce regional droughts and floods well beyond the long-term average. Seasonal monsoons across South Asia, East Asia, West Africa, and parts of the Americas deliver much of the year's precipitation in a few months and are foundational to the agricultural calendars of roughly half the world's population. Understanding how the hydrological cycle is expressed in each region is therefore essential for planning reservoirs, irrigation, flood defenses, and urban water supply.
Global Water Distribution
The familiar textbook estimate of Earth's water inventory originates from work by the United States Geological Survey and Russian hydrologist Igor Shiklomanov, whose 1993 compilation remains a standard global reference. Of the total 1.386 billion cubic kilometers of water on the planet, approximately 97.5 percent is saline, almost all of it held in the oceans, with a small remainder in saline lakes and saline groundwater. The remaining 2.5 percent, roughly 35 million cubic kilometers, is freshwater.
The freshwater share is dominated by ice. About 68.7 percent of all freshwater is stored in glaciers, ice caps, and permanent snowpack, the great majority of it in the Antarctic and Greenland ice sheets. Groundwater accounts for approximately 30.1 percent of freshwater. The surface and atmospheric freshwater that most people encounter in everyday life, including rivers, lakes, wetlands, soil moisture, atmospheric water vapor, and water in living tissues, together comprise only about 1.2 percent of global freshwater, or roughly 0.03 percent of all water on Earth.
Within that thin layer of readily accessible water, lakes hold the lion's share. Freshwater lakes contain approximately 91,000 cubic kilometers of water, soil moisture about 16,500 cubic kilometers, and the atmosphere about 12,900 cubic kilometers. Rivers at any given moment hold only about 2,120 cubic kilometers, a striking reminder that rivers are fast-moving conveyors rather than large reservoirs. The annual runoff that rivers deliver to the oceans, however, is many times their standing volume, because river water is continually replenished by precipitation and snowmelt.
Oceans and Saline Water
Approximately 1.35 billion cubic kilometers, or 97.5 percent of the global total. Oceans dominate the global water budget and drive the hydrological cycle through evaporation.
Glaciers and Polar Ice
Approximately 24 million cubic kilometers, or 68.7 percent of freshwater. Almost all of it is stored in the Antarctic and Greenland ice sheets and in mountain glaciers.
Groundwater
Approximately 10.5 million cubic kilometers of freshwater, or 30.1 percent. Includes shallow, actively circulating water and deep fossil groundwater recharged over geological time.
Lakes, Rivers, and Wetlands
Approximately 105,000 cubic kilometers. Only about 0.3 percent of freshwater, but the most important compartment for most human water uses.
Soil Moisture
Approximately 16,500 cubic kilometers. Essential for rain-fed agriculture and for recharging shallow aquifers; the so-called green water on which most food production depends.
Atmosphere and Biosphere
Approximately 12,900 cubic kilometers in the atmosphere and a smaller amount in living tissue. A small store, but the mobile link that redistributes water globally.
Surface Water: Rivers, Lakes, and Reservoirs
Surface water refers to freshwater on the land surface in rivers, streams, lakes, reservoirs, and wetlands. Although surface water represents a tiny fraction of total global freshwater, it supplies the majority of municipal and industrial withdrawals in most countries and remains the most visible and accessible part of the water resource base. Rivers are ranked by their discharge, which is the volume of water flowing past a given point per unit of time. The Amazon River in South America is by far the largest by discharge, carrying roughly 209,000 cubic meters per second at its mouth, about one fifth of all river water entering the oceans.
Other major rivers by discharge include the Congo in central Africa, the Ganges-Brahmaputra-Meghna system on the Indian subcontinent, the Yangtze and the Yenisey in Asia, the Orinoco and the Madeira in South America, and the Río de la Plata on the southern cone. The Nile and the Mississippi-Missouri rank among the longest rivers but carry smaller discharges, because they drain drier basins. For in-depth profiles of these systems, see the CountryReports page on world rivers and lakes.
Lakes contain more than half of all surface freshwater on the planet. Lake Baikal in southern Siberia is the world's largest freshwater lake by volume, holding approximately 23,000 cubic kilometers of water, more than all five of the North American Great Lakes combined. The African Great Lakes, including Lake Tanganyika and Lake Victoria, are among the largest and most biologically diverse freshwater lakes anywhere. Lake Superior has the largest surface area of any freshwater lake. The Caspian Sea is often listed with lakes because it is enclosed, but it is saline and its waters are not typically counted in global freshwater inventories.
Humans have dramatically expanded the volume of water held in surface storage by constructing dams and impoundments. The global inventory of large dams, defined as structures higher than 15 meters or with reservoir volumes above three million cubic meters, now exceeds 60,000, storing an estimated 7,000 to 8,300 cubic kilometers of water worldwide. Reservoirs extend the reliable yield of river systems, buffer seasonal and multi-year variability, generate hydroelectric power, and provide flood control, but they also fragment rivers, alter sediment transport, and displace communities upstream.

Groundwater and Aquifers
Groundwater is water stored in the pore spaces and fractures of soils and rocks beneath the land surface. It accounts for approximately 30 percent of global freshwater and, by volume, is roughly one hundred times larger than all surface freshwater combined. Hydrologists describe the subsurface zone in which pores are fully saturated as an aquifer. Aquifers may be unconfined, with a water table that rises and falls in direct response to recharge, or confined, where an overlying layer of low-permeability rock isolates the aquifer from surface pressure and the water is held under pressure between confining layers.
Groundwater flows slowly, often on the order of centimeters to meters per day, which means that aquifers can act as enormous natural storage reservoirs and smooth out the variability of surface water. In many parts of the world, groundwater is the only reliable source of supply during dry seasons or during multi-year droughts. However, where extraction exceeds long-term recharge, water tables fall, wells go dry, land can subside, and seawater can intrude into coastal aquifers. The NASA and German Aerospace Center GRACE and GRACE-Follow-On satellite missions have made it possible to observe changes in total water storage at continental scale and have documented persistent groundwater depletion in several major aquifer systems.
A small number of very large aquifer systems supply a disproportionate share of the world's groundwater. Some of these contain substantial quantities of fossil groundwater, recharged during wetter climates thousands of years ago and effectively non-renewable on human time scales.
Ogallala (High Plains) Aquifer
Underlies roughly 450,000 square kilometers of the Great Plains of the United States, from South Dakota to Texas. Supports extensive irrigated agriculture, especially in Nebraska, Kansas, and the Texas Panhandle. Significant long-term drawdown has been documented since mid-twentieth-century irrigation development.
- • Primary source: USGS High Plains water-level monitoring
- • Recharge highly uneven across the region
Great Artesian Basin
One of the largest confined aquifer systems in the world, covering about 1.7 million square kilometers under Australia. Supplies pastoral stations, Indigenous communities, and many inland settlements. Managed under a long-running federal and state rehabilitation program.
- • Confined aquifer; water under natural pressure
- • Recharge primarily along Great Dividing Range
North China Plain Aquifer
Supports intensive agriculture and the megacities of Beijing and Tianjin in China. Heavy withdrawals for wheat, maize, and urban supply have produced some of the world's most pronounced observed groundwater declines, partially offset by the South-North Water Transfer Project.
- • Shallow and deep aquifer components
- • Significant land subsidence in parts of Hebei
Nubian Sandstone Aquifer System
A transboundary fossil aquifer shared by Egypt, Libya, Sudan, and Chad, holding an estimated 150,000 cubic kilometers of largely non-renewable water laid down during wetter Saharan climates thousands of years ago. Managed under a joint authority of the four states.
- • Source for the Great Man-made River project
- • Essentially no modern recharge
Guarani Aquifer System
A transboundary aquifer shared by Brazil, Argentina, Paraguay, and Uruguay covering about 1.2 million square kilometers. One of the largest freshwater reserves in the world, with active recharge through sandstone outcrops.
- • Shared management under Guarani Aquifer Agreement (2010)
- • Water quality and recharge protection priorities
Arabian and Indo-Gangetic Aquifers
The Arabian aquifer system underlies the Saudi Arabian peninsula and supports desert agriculture. The Indo-Gangetic aquifer beneath India and Pakistan supports hundreds of millions of people and is heavily stressed by tube-well irrigation.
- • Two of the most stressed systems identified by GRACE
- • Arsenic and salinity concerns in parts of South Asia
Withdrawals and Use
Global freshwater withdrawals are estimated at approximately 4,000 cubic kilometers per year, according to the FAO AQUASTAT database. This is the volume of water extracted from rivers, lakes, reservoirs, and aquifers for human use; consumptive use, meaning water that evaporates or is incorporated into products and does not immediately return to the watershed, is considerably smaller. Withdrawals have roughly tripled since 1950, driven by population growth, urbanization, expansion of irrigated agriculture, and industrialization, although per capita withdrawals in high-income economies have been stable or declining for several decades.
Sectoral shares of withdrawal differ significantly among countries, but the global averages are broadly consistent. Agriculture accounts for approximately 70 percent of total withdrawals, industry for approximately 19 percent, and municipal uses, including domestic and commercial consumption, for approximately 11 percent. In many low- and middle-income countries, agricultural withdrawals exceed 80 percent of the national total, while in highly industrialized economies the industrial share can approach 50 percent. Irrigation is overwhelmingly the dominant use at global scale: more than 300 million hectares of farmland are equipped for irrigation, and irrigated agriculture produces roughly 40 percent of global food on about 20 percent of cultivated land.
The concept of virtual water, introduced by geographer Tony Allan, describes the quantity of water embedded in the production of a traded good. A kilogram of beef, for example, typically requires thousands of liters of water to produce, while a kilogram of wheat requires on the order of 1,500 liters. Trade in food effectively redistributes water from exporting basins to importing regions, and many water-scarce countries have adopted an implicit policy of importing food rather than growing it locally, thereby conserving domestic water. The related concept of a water footprint, developed by the Water Footprint Network and building on peer-reviewed literature in Water Resources Research and the Journal of Hydrology, allocates green, blue, and grey water use to products, sectors, and countries.
Food security, industrial productivity, and household water service levels are all closely tied to water use efficiency. Drip and micro-sprinkler irrigation, recycled process water in industry, and metered municipal supply with pressure management all reduce the amount of water needed per unit of output or per person served. The International Water Management Institute has shown that such efficiency gains, combined with conjunctive use of surface and groundwater, can substantially extend existing water resources before new supply projects become necessary. See also the related CountryReports page on nutrition and food security.
Water Scarcity and Stress
Water scarcity is not simply a question of how much water falls as precipitation. Hydrologists distinguish physical water scarcity, in which renewable water resources are genuinely insufficient to meet demand, from economic water scarcity, in which adequate resources exist but cannot be accessed because of a lack of infrastructure, institutions, or investment. Physical scarcity is typical of arid and semi-arid regions such as the Arabian Peninsula, North Africa, northern China, the western United States, and parts of Australia. Economic scarcity is more common in sub-Saharan Africa and parts of South and Southeast Asia, where rainfall can be abundant but supply systems are underdeveloped.
Several widely used indices quantify water stress. The Falkenmark indicator classifies countries with less than 1,700 cubic meters of renewable freshwater per person per year as water stressed, below 1,000 as water scarce, and below 500 as absolute water scarcity. More sophisticated measures, such as the Water Stress Index published by the World Resources Institute through its Aqueduct platform, assess the ratio of total withdrawals to available renewable supply at basin scale, typically expressed as a percentage. Basins with ratios above 40 percent are considered highly stressed, and those above 80 percent extremely stressed. Under current conditions, more than two billion people live in countries experiencing high water stress, and that number is expected to grow as populations and economies expand.
Droughts are natural features of the climate, but their impacts can be amplified by land use change, groundwater overdraft, and reliance on surface water in river basins where supply is shrinking. Recent high-profile episodes include the multi-year Millennium Drought in Australia, the California drought of the early 2010s, the Cape Town Day Zero crisis in South Africa in 2017 to 2018, and recurrent droughts in the Horn of Africa. Related risks are discussed further on the CountryReports pages on deserts of the world and natural disasters.
Infrastructure and Engineering
Human societies have built an extraordinary range of engineered works to capture, store, move, and treat water. Dams, canals, long-distance pipelines, desalination plants, and urban water networks together form the hydraulic backbone of modern economies. These systems extend the reliable yield of natural resources, connect water-rich and water-poor regions, and allow agriculture, cities, and industry to exist in places they otherwise could not.
Large Dams
More than 60,000 large dams are operating worldwide. Notable examples include the Three Gorges Dam on the Yangtze in China, Hoover Dam on the Colorado in the United States, the Aswan High Dam on the Nile in Egypt, the Itaipú Dam on the Paraná shared by Brazil and Paraguay, and the Grand Ethiopian Renaissance Dam on the Blue Nile in Ethiopia.
- • Water supply, hydropower, flood control
- • Social and ecological trade-offs
Canals and Shipping Waterways
Engineered waterways connect basins and oceans. The Suez Canal links the Mediterranean and Red Seas through Egypt, the Panama Canal crosses the isthmus of Central America, and China's Grand Canal, extended over centuries, remains the longest artificial waterway in the world. Inland canals also transfer water for irrigation and municipal supply.
- • Maritime trade and inter-basin transfers
- • Lock systems manage elevation differences
Long-Distance Pipelines and Transfers
China's South-North Water Transfer Project moves water from the Yangtze basin to the Yellow River basin along three main routes. California's State Water Project transports water from the Sacramento Delta to Southern California. Libya's Great Man-made River pipes fossil water from the Nubian Sandstone Aquifer to coastal cities.
- • Redistribute water among regions
- • Very energy- and capital-intensive
Desalination
More than 20,000 desalination plants operate worldwide, producing roughly 100 million cubic meters of freshwater per day. Concentrations are highest in Saudi Arabia, the United Arab Emirates, Israel, Kuwait, Qatar, Spain, and parts of California. Reverse osmosis has largely displaced thermal distillation.
- • Energy-intensive but decoupled from rainfall
- • Brine disposal and coastal impacts
Urban Water and Wastewater
Municipal utilities treat, pressurize, and distribute drinking water and collect and treat wastewater. In high-income cities, coverage is near universal; in many rapidly growing cities, extension of piped networks, leak reduction, and sewage treatment remain central challenges.
- • Non-revenue water losses can exceed 30 percent
- • Wastewater reuse increasingly important
Hydroelectric Power
Hydropower generates approximately 15 percent of global electricity and more than half of electricity in countries such as Norway, Brazil, and Canada. Reservoir hydropower also provides storage that complements intermittent renewables such as wind and solar.
- • Largest single source of renewable electricity
- • Basin-scale ecological and social implications

Transboundary Waters and Treaties
According to UN Water and UNESCO, 286 international river basins and approximately 600 transboundary aquifers cross political borders, together covering about 46 percent of Earth's land surface and supplying roughly 60 percent of global freshwater flow. Cooperation in shared basins is the norm rather than the exception: more than 300 international water treaties have been signed since 1948, and many basins operate under standing commissions. The following are among the most consequential transboundary systems.
The Nile is shared among eleven countries of northeast Africa. The Nile Basin Initiative, launched in 1999, is a transitional intergovernmental partnership that works toward an agreed framework for equitable use. Construction of the Grand Ethiopian Renaissance Dam on the Blue Nile has intensified negotiations over flow patterns, especially during reservoir filling, among Ethiopia, Sudan, and Egypt.
The Mekong River flows through China, Myanmar, Laos, Thailand, Cambodia, and Vietnam. The Mekong River Commission, established in 1995 by Cambodia, Laos, Thailand, and Vietnam, provides a forum for joint data collection, flow monitoring, and consultation on major infrastructure. Hydropower development in the upper basin and sediment changes in the delta are central concerns.
The Indus basin spans Pakistan, India, China, and Afghanistan. The Indus Waters Treaty of 1960, brokered by the World Bank, allocates the three eastern rivers primarily to India and the three western rivers primarily to Pakistan, and has endured multiple wars and political crises between the two countries. It is frequently cited as one of the most durable water treaties in modern international law.
The Tigris-Euphrates system is shared by Turkey, Syria, Iraq, and Iran. The Southeastern Anatolia Project in Turkey has significantly altered flows, and no comprehensive basin agreement has yet been ratified, although bilateral arrangements exist. The Jordan River basin, shared by Israel, Jordan, and the Palestinian territories, is governed in part by the 1994 Israel-Jordan peace treaty, which includes specific annexes on water.
In Europe, the Danube flows through or borders nineteen countries and is managed under the International Commission for the Protection of the Danube River, established by the Danube Convention of 1994. The Rhine, often cited as a model of transboundary recovery, is managed by the International Commission for the Protection of the Rhine, whose long-running water quality program reversed severe twentieth-century pollution. The Congo Basin supports the world's second-largest river by discharge and is managed in part through the International Commission of the Congo-Oubangui-Sangha Basin.
In North America, the Columbia River Treaty of 1961 between the United States and Canada coordinates flood control and hydropower generation, and the 1944 Treaty on Utilization of Waters of the Colorado and Tijuana Rivers and of the Rio Grande allocates shared flows between the United States and Mexico. The Rio Negro photograph below illustrates the scale of one major tropical transboundary system.

WASH, SDG 6, and Wetland Conservation
Water, Sanitation, and Hygiene, abbreviated WASH, describes the public-health conditions under which people drink, cook, bathe, and manage human waste. The WHO/UNICEF Joint Monitoring Programme for Water Supply, Sanitation and Hygiene has reported on global progress since 1990 and is the official custodian of data for several indicators under Sustainable Development Goal 6. According to the most recent JMP reporting, approximately 2.2 billion people worldwide still lack safely managed drinking water services, 3.5 billion lack safely managed sanitation services, and around 2 billion people use drinking water sources that are contaminated with feces.
Sustainable Development Goal 6, adopted by the United Nations General Assembly in 2015 as part of the 2030 Agenda, aims to ensure availability and sustainable management of water and sanitation for all. It comprises eight targets addressing universal access to drinking water (SDG 6.1), sanitation and hygiene (SDG 6.2), water quality and wastewater treatment (SDG 6.3), water-use efficiency and scarcity (SDG 6.4), integrated water resources management including transboundary cooperation (SDG 6.5), protection of water-related ecosystems (SDG 6.6), international support and capacity building (SDG 6.a), and participation of local communities (SDG 6.b). Progress at the current rate will not meet the 2030 targets, and UN-Water has called for a substantial acceleration in national investment and international support.
Healthy wetlands, including marshes, swamps, peatlands, and coastal estuaries, are essential for water resources. They filter pollutants, recharge groundwater, buffer floods, support fisheries, and shelter a disproportionately large share of biodiversity. The Ramsar Convention on Wetlands of International Importance, adopted in 1971 in the Iranian city of Ramsar, is the oldest multilateral environmental agreement and the only one dedicated to a single ecosystem type. As of the most recent reporting, its 172 contracting parties have designated more than 2,500 Ramsar sites covering over 2.5 million square kilometers.
Effective water resources management links these threads together. Integrated Water Resources Management, endorsed in the Dublin Principles of 1992 and reinforced in SDG 6.5, encourages management at the river-basin scale, balanced consideration of economic, social, and environmental objectives, participation of all water users, and recognition of water as an economic as well as a social good. The 1992 UNECE Water Convention, which became open to accession by any United Nations member state in 2016, and the 1997 UN Watercourses Convention together provide the main multilateral legal framework for cooperation on transboundary water. Related CountryReports pages include biomes and ecosystems and forests and rainforests.
Sources
Detailed citations, data references, and institutional sources for all CountryReports content are listed on the Sources page. The following intergovernmental bodies, scientific agencies, and peer-reviewed journals are the primary authorities we rely on for content related to world water resources. Each link points to the institution's homepage or relevant subsite.
UN System and Intergovernmental Bodies
- UN-Water — United Nations inter-agency coordination mechanism on freshwater issues, with thematic briefs, annual synthesis reports, and data on Sustainable Development Goal 6.
- UNESCO World Water Assessment Programme (WWAP) — Produces the annual United Nations World Water Development Report and hosts the UN-Water assessment framework.
- FAO AQUASTAT — Global information system on water and agriculture maintained by the Food and Agriculture Organization of the United Nations, with country-level withdrawal, irrigation, and dam data.
- UNECE Water Convention — Secretariat of the 1992 Convention on the Protection and Use of Transboundary Watercourses and International Lakes.
- United Nations Department of Economic and Social Affairs (UN-DESA) — Policy coordination on sustainable development, including the SDG 6 monitoring framework.
- Ramsar Convention on Wetlands Secretariat — Intergovernmental treaty on wetland conservation, list of Ramsar sites, and national reporting.
Scientific and Monitoring Agencies
- United States Geological Survey — Water Resources — Stream gauge data, groundwater monitoring, the USGS Water Science School, and Shiklomanov's global water inventory.
- WHO/UNICEF Joint Monitoring Programme (JMP) for Water Supply, Sanitation and Hygiene — Official custodian of SDG 6.1 and 6.2 indicators; publishes global WASH progress reports.
- World Health Organization — Water, Sanitation and Health — Drinking-water guidelines, sanitation standards, and public-health evidence on waterborne disease.
- NASA Jet Propulsion Laboratory — GRACE and GRACE-FO — Satellite missions that measure changes in total terrestrial water storage, including global groundwater trends.
- UNESCO Intergovernmental Hydrological Programme — Intergovernmental science programme in hydrology and water resources.
Research Institutes and Development Finance
- International Water Management Institute (IWMI) — CGIAR research center specializing in agricultural water management, groundwater, and basin-scale planning in low- and middle-income countries.
- Pacific Institute — Independent research institute on global water issues, including the Water Conflict Chronology.
- World Bank — Water Global Practice — Investment in water supply, sanitation, irrigation, and water resources management across developing economies.
- World Resources Institute — Aqueduct — Global water risk and stress mapping platform used by companies, governments, and researchers.
- International Association of Hydrological Sciences (IAHS) — International learned society for hydrology and publisher of Hydrological Sciences Journal.
Peer-Reviewed Journals
If you notice an error or would like to suggest a correction, please use our contact page to get in touch.